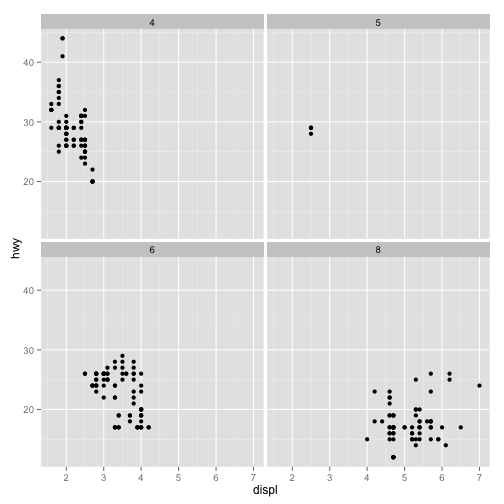
In statistical plotting, a facet is a type of plot. Data is split into subsets and the subsets are plotted in a row or grid of subplots.
The term is common among users of ggplot2, a plotting package for the R statistical computing language.
Facet is also the name of a plotting and visualizaton tool created by the People + AI Research (PAIR) initiative at Google.